What is the "frequency response curve" "Frequency response curve" decomposition: "Frequency" means "frequency", which is the same as "tone" in sound performance; "ring" can be regarded as the conversion of the "frequency" of the input electrical signal into a speaker system (mechanical and electrical). The response of sound energy. This response is received by the microphone and presented by the test instrument in the form of a dB SPL logarithm. When a lot of "frequency" response values ​​are connected together, it becomes a "curve" with peaks and valleys. This curve is called a frequency characteristic response curve, which is called a frequency response curve. Speaker and frequency response curve Is the frequency response curve of the sound system or speaker product required to be straight? Many people argue on this issue, and the focus of the debate is often: good is not necessarily straight, and straight is not necessarily good. For example, the curve of a certain speaker near 80 Hz is more prominent, then it shows that this speaker is too strong for the frequency band near 80 Hz. If you play music, the bass sound will feel heavy. Or the curve of a certain speaker has a depression near 1000 Hz, which means that the speaker has weak performance for the frequency band near 1000 Hz, and the sound pressure output from the frequency band near 1000 Hz is reduced. The sound is not the same. The flatness of the frequency response curve is actually telling you the difference in the amount of gain of the sound signal of this speaker or sound system for different frequency bands. The flatter the curve, the closer the gain of each band of the speaker or sound system is. However, the speaker or system has the same amount of gain for each frequency band of the input signal and is not equal to the picture. why? Because the same amount of gain only expresses the same amount of amplification of the sound in each frequency band of the input signal. For example, if a system has a gain of 30 decibels for each frequency in the whole audio, you emit a sound of 1000 Hz, and the sound pressure level is At 80 decibels, the sound pressure level of the 1000 Hz sound from the speaker is 80+30=110 dB. The sound pressure level of your 2000 Hz sound is 60 decibels, then the sound pressure level of the 2000 Hz sound played by the speaker is 90 decibels. When the system is not amplified, the sound pressure level of 1000 Hz and 2000 Hz is 20 dB. Then, through this system with the same amount of gain for each frequency band, the sound pressure level of 1000 Hz sound and 2000 Hz sound emitted by the speaker is also 20 dB, and the formation remains unchanged, huh, huh. However, if your system has too much gain for 1000 Hz (highlighted on the curve), it is not 30 decibels but 40 decibels, and the gain for 2000 Hz is low (the curve is concave), not 30 decibels. It is 20 decibels. Then the sound of 1000 Hz, which was originally sent out by the 80-dB sound pressure level, passed through the system, and it sounded 120 decibels. The original 60 Hz sound of 2000 Hz, after passing through the system, sent 80 decibels. sound. The difference between the sound pressure level of 1000 Hz and 2000 Hz before the system is 20 decibels. After the system, the difference of sound pressure level between 1000 Hz and 2000 Hz becomes 40 decibels. This is not the original difference, and the formation has changed. This is also a kind of distortion. Therefore, whether the frequency response curve is straight or not, it only represents whether the sound volume of a certain speaker or a certain system is almost the same for the sound volume of each frequency band, and has nothing to do with the sound quality. As for the good news, first of all, your system should have the same amount of gain for the input signal in each frequency band (that is, the curve should be as straight as possible), so that the proportion of the sound size of each frequency band in the original signal can be amplified and restored. At least it should be strong, but not strong. It is a good foundation to be able to truly reflect the strength of sound. To be nice, it is more important to make a fuss about sound quality. The sound quality is rotten, no matter how good the system is also showing a bad sound, do not believe that you get a cow B's speaker, use a dozens of MP3 input to the mixer, and turn the mixer input gain to the head, play from the Internet Download the music in MP3 format and try it out. The sound quality is the inner thing, it is not just a straight curve problem. The curve is straight, just expressing the system's restoration of the volume. Then the restoration of sound quality is estimated to be idealized. For example, a piano song recorded by a DPA microphone for a person's home Steinway piano, it is almost impossible to completely restore the texture through the sound. This is like listening to someone playing violin next to you, just like listening to the same person playing violin music next to the speaker, even if you use the best sound, it will always be different. This involves the problem of sound quality reduction and sound field reduction, and these reductions are not to say who can express it with curves. The quality of the sound, there is a lot to do with your materials, your craft, the designer's technology and artistic accomplishment. Does the master use white jade carvings to look like the same thing that street craftsmen used to mold out? Headphone and frequency response curve (Photo from HEDROOM) The center of the earphone sound film is a high frequency for the low frequency edge. The low frequency end of the frequency response curve is a downward trend. In order to obtain more low frequency kinetic energy, the spherical design of the center of the earphone is to increase the surface area of ​​the earphone to obtain the bass. The frequency response curve of the headphone intermediate frequency is relatively flat because of the surface of the sound film. Spiral lines. There is a large sawtooth on the frequency response curve of the high-frequency end of the earphone because the soft ring on the edge of the sound film is to increase the elasticity of the sound film. Therefore, the resonant frequency of the soft material drops. After the soft ring reaches the bonding edge, the material hardens and resonates. The frequency rises to form a large sawtooth. Every headset is unavoidable. There are many small serrations on the frequency response curve of the high-frequency end of the earphone, and the edge of the sound film holder and the sound film are burred. It is related to the manufacturing process of the earphone. If the bracket and the sound film are integrated, there will be no such problem. Knowing the above situation, we pay attention to his frequency response curve when choosing headphones, the low-end gain is large, the low-frequency small sawtooth is less, and the intermediate frequency is flat. Sound quality and frequency response curve There are too many factors that affect sound quality. Let's first look at what is sound quality. The sound quality refers to the closeness of the actual sound wave to the original waveform, that is, the closer the actual sound wave played back to the waveform saved by the original audio file, the better the sound quality. Suppose there is an audio file A.wav, and there is an ideal recording device, which can record the sound in the air without any loss, save it as B.wav, then this A.wav and B.wav (from the time domain) And the frequency domain is closer to the better (more please read the chinaaudio.net main text: what is the sound quality). For a system (device), the amplitude-frequency response and the phase-frequency response together constitute the response of the entire system, and the general frequency response curve only refers to the amplitude-frequency response. The process of playing an audio file from the phone to what is affected by the sound quality. The general process is this: audio file -> operating system mixer (Mixer) -> operating system DSP algorithm (sound effect, resampling, may use DSP chip) -> DAC -> amplifier -> headphone / speaker - > Air -> Human ear. Since the air and the human ear are uncontrollable, only the sound coming out of the speaker/earphone is studied. Almost every step in front of this will affect the sound quality. The first is the mixer of the operating system, which is responsible for mixing together the programs that play the sounds in the system, so that each program can sound simultaneously without a program that monopolizes the output device and other programs cannot sound. Expressed in the code is to add, the output of each program is added up. If only one program is playing music, it's okay, but the phone also has to deal with ringtones and reminders. How is addition done? It depends on the algorithm. If it is a fixed point addition, in order to ensure that the added value will not overflow, the two data will be shifted right and then added. The situation of floating point is more complicated, and because most of the existing audio files are in 16-bit fixed-point format, the conversion between fixed-point <-> floating points is also required, and this process also loses precision. In short, the program trades for dynamic range by sacrificing precision. And if only one program is outputting? Don't forget that there is something to adjust the volume. That is to multiply each point on the waveform by a gain value. The multiplication process also has a loss of precision. In general, the loss of precision in this step of the mixer is unavoidable. However, in addition to the input and output processes on the mobile phone, the floating-point operation is in the middle, and the loss of accuracy generally does not exceed -90dB, which is generally inaudible. Then there is the DSP algorithm part. The part of the sound effect (bass enhancement, increased spatial sense, etc.) is subjective and does not belong to the category of "sound quality" and will not be discussed. Assuming all sound effects are off, the only thing left is resampling. For mobile phones, resampling exists because a DSP chip often only supports one output sample rate, or the DAC only supports one input sample rate, and in most cases this sample rate is 48 kHz. This is due to the fact that if different sampling rates are to be supported, especially for sample values ​​that are not integer-like, such as 44.1 kHz and 48 kHz, crystals with different frequencies are required. For a variety of reasons, it is easier for the crystal to generate a clock frequency of 48kHz. However, for most historical reasons, most of the current music is 44.1 kHz, so it will undergo a resampling of 44.1 kHz -> 48 kHz. Non-integer multiple resampling will greatly reduce the accuracy. Do not think that the sampling rate will be higher and the sound quality will be better. The best sound quality is output directly without resampling. The effect of resampling on sound quality depends on the resampling algorithm, which can cause severe distortion. Next is the DAC, the digital to analog converter. This is a module that has a significant impact on sound quality. The frequency response of the DAC is also easy to straighten, but there are many other parameters that need to be referenced to measure the sound quality of the DAC. The quality of the DAC can basically depend on the manufacturer and model of the chip itself, so there is nothing to say. Good equipment will use a higher-end DAC. Then there is the amplifier. Relatively speaking, this part is relatively easy to achieve a flat amplitude frequency curve. But the phase frequency is not necessarily. (The frequency response of the amplifier is now very easy to be straight) Finally, the headphones/speakers. In general, their amplitude-frequency curves are difficult to straighten, largely because the frequency at which the sounding unit can emit is inversely proportional to its size. So don't expect the earbuds to emit effective low frequencies. This is also the main reason why headphones generally have better sound quality than earbuds or earphones. For the speaker, it is often used two-way, three-way, or even multi-frequency, that is, multiple sounding units are responsible for different frequency bands, among which there are problems such as filtering and processing frequency band connection. From the perspective of the entire audio stream, the headphones/speakers are the most influential part of the sound quality. All the mobile phones in your mobile phone are lossless music, the mobile phone supports direct output 44.1kHz, the DAC is the best chip, the amplifier is almost no distortion, and you use a pair of 50 yuan street stalls to buy headphones, the sound quality It is a slag. can. In theory, the flatter the frequency response curve is, the closer the system response is to the through. But looking at a frequency response curve is very incomplete. Very few. 3. For mobile phones, what are the parameters that affect sound quality? Other commonly used parameters for evaluating sound quality are distortion, signal to noise ratio, and the like. Tone and frequency response curve The test environment is better, for example, in the standard non-sounding room, no one is operating error, and the curve is controlled within 1dB. At this time, it is necessary to consider the different number of points and smoothing mode of the curve. The difference between the number of points taken and the smoothing mode for the details of the frequency response curve is very different. (In the test frequency range, the instrument selects the number of response values ​​of different frequency points. The more points, the more accurate the test. The instrument smooths the sampling smoothness of the frequency response amplitude in the frequency range, for example, 1/6 oct, 1/12 oct, 1 /24oct, 1/48oct, etc., the larger the denominator, the more accurate the data). So, if you want to understand the changes in these details on the frequency response curve, the price is a good standard test environment. When the speaker's frequency response curve is the same, its tone is determined by its harmonic content. When the speaker frequency response curve is the same, if the tone is different, the harmonic curve of the speaker needs to be compared. Vintage Fan Heater is ideal for use in an office or a small room and looks retro. This heater is an automatic thermostat control with four positions for fan only, warm, hot, as well as off. The Heater Fan has a safety switch to shut off when tip over. It also has a thermal cut-off safety, a thermal fuse and a indicator light to let you know when it is working or not. This Fan Heater has two heat settings: 1000 and 2000 watts. When you just want to circulate some air, you can set it to cool fan only. or Keep warm when winter.
Vintage fan heater use retro design from 1950'-1960' year. We have ODM for Italy customer for Retro Fan Heaters.
If you need, please contact us
thanks
Vintage Fan Heater Warmlite Fan Heater,Fan Assisted Storage Heaters,Car Fan Heater,Cheap Fan Heater Fenry manufacturing Co., Ltd , https://www.cnfenry.com
The frequency response curve of the speaker or sound system needs to be straight. Why?
The frequency response curve of the speaker or sound system is straight. The meaning of this is to tell the user that this speaker or system, under certain conditions, for the input signal, the performance in each frequency band (that is, the sound of different frequency bands) The amount of gain is almost the same, which bands are not highlighted (boosted), and which bands are not compromised (attenuated). How much do you have, how much I will show you. The speaker or system with a flat curve is inconsistent in the amount of gain in some frequency bands, too strong in some frequency bands (where the curve is prominent, the amount of gain is large) or too weak (depression on the curve) Where the amount of gain is small). Figure: 
Conversely, the curve is straight and the curve is straight. The system or device has a high degree of reduction in the volume of each frequency band in the input signal. As a sound, this is only a basic indicator, but it is also an important indicator. For example, a sound system with a good volume reduction, the input source signal itself is high, medium, low, etc. The volume ratio of each part is harmonious (such as the music master's work recorded by the recording master, it seems like a fever, etc.), through the speaker When you restore it, you feel harmonious. If the input signal is a song sung by a karaoke-level singer who can only scream and scream, the original high school bass is not harmonious, and it is naturally unharmonious from the high-reduction sound system. However, systems with poor reductiveness, such as the frequency response curve at low frequencies, and the middle and high frequencies are somewhat sunken, may strengthen the bass that was not very strong, weaken the original trumpet, play the original Works with harmonious volume levels may become discordant. However, if you happen to encounter a situation where the musician has weakened the strong bass sound, or if the weak trumpet sound is blown strong, the negative and negative sounds are played, and the original volume is not harmonious. Such a low-reducing speaker may be more harmonious than a more reductive speaker.
In addition, for audio products, in fact, not only speakers, amplifiers, mixers and other peripheral equipment, there are frequency response curves. According to industry standards, these devices are required to have a flat frequency response curve without adjustment. The purpose is to require these devices to first maintain a faithful attitude towards the volume of the signal. If you use an equalizer, if there is no adjustment, the fader is flat, the frequency response curve is high at 80 Hz, and it is low at 1000 Hz. Would you still want it? 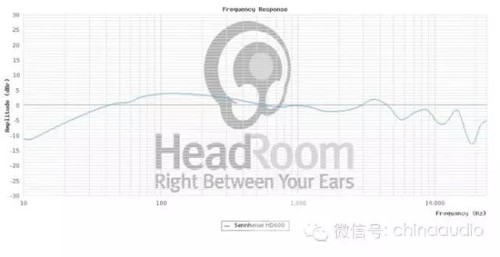
It is not easy to see the quality of the headphones through the frequency response curve. 
In general:
1. Can the frequency response curve reflect the sound quality?
2. To what extent does the amplifier's frequency response curve determine the sound quality?
The mixer and resampling algorithm are the same or similar for each phone.
Amplifiers are more important. At present, mobile phone amplifiers can achieve good system response, so everyone has little difference.
DAC, more important, look at the chip model.
The decisive part is still in your playback device, using a better headset or speaker than anything else.
From the "frequency" analysis: We will find the same "tone" (frequency) sound in different instruments, the "tone" is different, then what factor determines the instrument sound?
A: It is because the "tone" (frequency) contains different harmonic components.
We know that sound is generated by vibration. While an object vibrates back and forth, it is almost impossible to vibrate at a certain period. That is to say, when an object sounds, many waves (harmonics) of different frequencies are emitted. These many different frequency waves have little phase difference (the time between waves is very short), and people can't distinguish them separately, so these waves will be mixed together to give a whole sound experience, and this feeling is called sound.
Some people have questioned that although the "tone" in the actual instrument is the same, it is difficult to ensure that the contrast sound pressure/loudness can be consistent when blowing, pulling, and bombing, so the sound we hear will certainly be different.
To rule out this point, an experiment can be done: theoretically, when two sounds of the same sound pressure level are superimposed, the total sound pressure level at the reference axis is increased by 3 dB. We take two speakers with the same sound pressure level at the same frequency to superimpose the sound, and then listen to the sound with a single +3dB unit. The end result is that the sound heard by the same sound pressure level still feels very different. (At this time, only when the harmonic conditions of the superimposed sound pressure are the same as the harmonic components of a single +3dB speaker, the timbre is not easy to distinguish)
Since every sound in a musical instrument contains sound waves of many frequencies, how do we distinguish the pitch (frequency)?
A: The frequency at which the relative amount of a certain frequency is the largest in a sound determines the pitch of the sound. For example, a sound contains 3 units of 444Hz (la tone), 1 unit of 222Hz frequency, then we hear the la tone. And there are 3 units of 444Hz, 1 unit of 333Hz frequency, then we still sound la, but the sound is different.
Explaining the relationship between "frequency", "sound" and "sound", then explain some of the problems that should be paid attention to in the test curve during the development of the speaker (here the low frequency resonance and high frequency upper limit on the tone change, focus on Tell the question of the sound pressure level difference in the middle band).
1. In the average sensitivity column of many company speaker specifications, there will be the following signs, such as: 82dB ± 3dB. Therefore, many people in the copy of the speaker, within the allowable range of 82dB, it is considered that the development task is completed, and the sample is judged to be NG after listening.
Because of the logarithmic relationship between the dB SPL values, this indicates that a relatively wide sound pressure (strong) range is included in 1 dB. The human ear can distinguish the difference of 1dB sound pressure level in the more sensitive frequency band. Therefore, in the development process, the dB SPL of the mid-band should be controlled within ±0.5 dB.
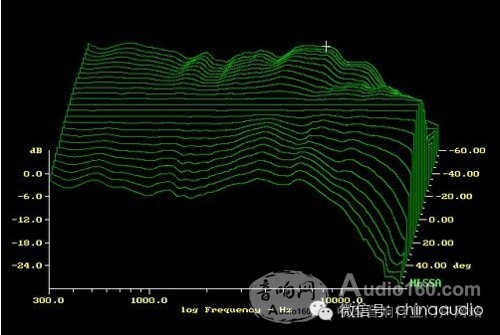
2. Some engineers have made the SPL value difference within 1dB, even closer. At this point, the tone still feels different. The way the test environment and curve behave should be considered. When the test environment is poor, the environment has a large interference to the test microphone. There are large errors in several curves tested on the same speaker. Therefore, it is necessary to repeat the test and eliminate the influence factor of the environment, and then analyze.
It should be noted that when using multi-point numbers and curve comparison without smoothing function, in addition to the environmental factor, there are some problems. For example, in the above harmonics: it is almost impossible to vibrate in a certain cycle because of the back and forth vibration of the object. At this time, there will be a phenomenon in which the sound pressure level drifts at some frequencies. At this time, according to the function of the instrument, the frequency range of the original test can be segmented, more points can be scanned, and the response trend of the frequency band can be understood in multiple directions.
3. Exclude the test error factor, compare the harmonic components of the speakers with very close frequency response curves, and find out the direction of the next improvement. Generally, instruments that test harmonic distortion can easily compare harmonic components.
(Because in practical applications, there are many factors affecting the sense of hearing, such as: the psychological and physiological factors of the listener, the reverberation coefficient of the room, the directivity of the speaker, etc., which will cause a difference in the sense of hearing. Do some simple explanations on the test and listening of the reference axis.)
Conclusion:
During the test, you need to pay full attention to the impact of the operators, test instruments, methods of use, test environment and treatment tools on the test results, and use as many points as possible and less smooth.